Price changes in the stock market occur on all-time scales. From a tick in milliseconds all the way to decades and even centuries, prices have a certain pattern. And behind all these constantly influx price changes is trading volume. Why does it matter?
Trading volume refers to the number of shares or contracts traded in single trading session or period of sessions for an ETF, stock, or other type of security. And volume matters because it can tell us about the strength or weakness of a move.
AUDIO: Listen to Ron DeLegge @ The Index Investing Show
For instance, if the S&P 500 (NYSEARCA:IVV) falls 2% on a certain trading day after being in a long period of uptrend, is it significant or not? Trading volume behind the price move can tell us the answer. If volume is high or above average, it’s probably a sign the reversal is genuine. But if volume is below average, a lack of conviction puts the price change or movement in doubt. What does today’s trading volume tell us about the health and direction of the market?
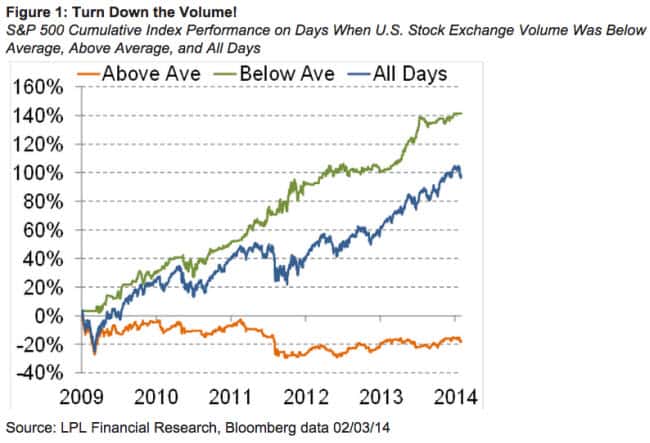
Our first chart shows the S&P 500’s (NYSEARCA:VOO) cumulative performance during three types of volume scenarios: 1) Above average, 2) below average, and 3) blended results. You’ll notice how the S&P’s five-year advance has been on the heels of below average trading volume, which is a tell-tale sign of missing conviction. Conversely, above the average volume in stocks is highly correlated with negative performance. Translation: A structurally sound bull market should be supported by above average trading volume not low volume as we have now.
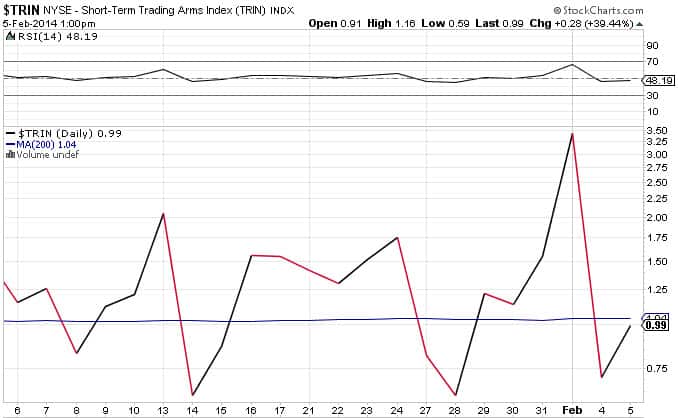
Finally, the TRIN (also known as the Arms Index) offers another angle.
Our chart below shows how the TRIN has spent most of the past month above its 200-day moving average. Generally, strong market upswings have low TRIN readings because the up volume in stocks (NYSEARCA:IWM) overtakes down volume, which results in a relative high AD Volume Ratio. But that’s not the case right now.
The ETF Profit Strategy Newsletter uses technical, fundamental, and sentiment analysis along with market history and common sense to keep investors on the right side of the market. In 2013, 70% of our weekly ETF picks were winners led by our biggest gainer, a 525% slam dunk.
Follow us on Twittter @ ETFguide