Do stock market correlations matter?
Statisticians use correlations (or cross-correlation) to measure the relationship between asset classes or investments. The general idea is to better understand the similarity or dissimilarity in how investments perform against each other and to build a portfolio of investments that can benefit.
The CBOE S&P 500 Implied Correlation Index (ChicagoOptions:^KCJ) also known as the “ICI” is one such statistical measure that uses options to estimate the average correlation among the largest 50 stocks inside the S&P 500 Index. The ICI recently hit 52-week lows indicating ultra low correlations between individual stocks and sectors.
Should investors use correlations between assets to make investment decisions? Before answering that question, let’s give a brief overview of how correlations work.
(Audio) Financial Literacy Month has Just been EXTENDED!
A correlation of +1.0 means that two investments have a perfect positive correlation. That simply means a correlation of +1.0 or close to it, is something you would expect from investments that perform and behave similarly.
Here’s an example: The historical performance and behavior of Intel (NasdaqGS:INTC) closely resembles the broader technology sector of stocks (NYSEARCA:XLK), which also happens to be Intel’s peer group. Should it be a surprise that Intel’s return pattern is similar to other technology stocks? Not at all, because individual stocks tend to behave similarly to the industry sectors where they reside.
In contrast, a correlation of -1.0 describes two investments with a perfect negative correlation. This means the return path of the two investments move opposite one another.
Here’s an example: The relationship between the S&P 500 Index (NYSEARCA:SPY) and CBOE S&P 500 Volatility Index (ChicagoOptions: ^VIX) could be described as a nearly perfect negative correlation. Why? Because the historical movements of VIX (NYSEARCA:VXX) have been opposite the S&P 500 around 80% of the time.
Investments with a correlation near 0 have return paths that are neither positive or negative but rather unrelated.
TEXT 33444 and TYPE “PORTCHECK” to receive your complimentary portfolio building checklist
If you’re going to use historical market correlations to make buy/sell or asset allocation decisions within your investment portfolio, here’s a few helpful pointers:
- 1) Beware of overemphasizing the long-term relationships between different asset classes. Why? Because short-term and intermediate correlations can vary widely compared to longer-term relationships.
- 2) Market correlations go up, go down and sometimes they even stay the same. But correlations are never indefinite.
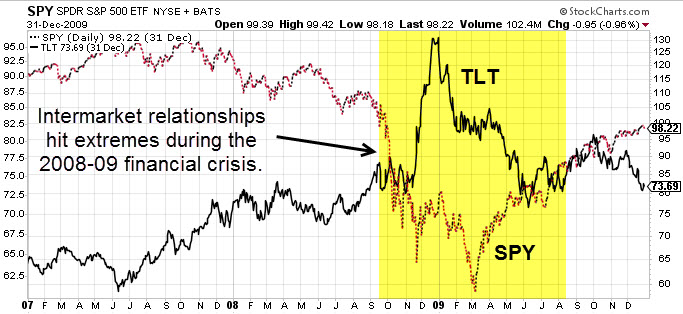
- 3) Market correlations sometimes go haywire. How? Correlations between asset classes during bear markets or crisis-like environments can hit extreme levels. (see chart above)
- 4) Historical market correlations will sometimes repeat themselves, but sometimes they won’t. (See point #1)
- 5) Stop making future decisions based upon the past. Why? Because future market correlations are variable and unpredictable.
Whether you decide to use market correlations or not, the most important thing to remember is that long-term historical relationships between various asset classes don’t always pan out in the short-run. For example, just because gold (NYSEARCA:IAU) is rising like it is right now, doesn’t necessarily mean that distinctly different asset classes like real estate (NYSEARCA:VNQ) or bonds (NYSEARCA:BOND) will fall. (And they haven’t thus far in 2016.)
Finally, just because market correlations behaved a certain way during a certain market cycle of inflation or deflation doesn’t necessarily mean correlations will act similarly during future market cycles.
Despite their limitations, historical market correlations can still be helpful. Ultimately, they provide us with perspective by shedding light on how asset prices behaved in the past and how they might behave in the future.


