It’s been three years since the last significant stock market decline. The 19% slide from April 2011 to October 2011 stoked fear, but still missed the official definition of 20% bear market.
This time around, it’s still too early to know whether the modest pullback in the S&P 500 (SNP:^GSPC) that began several months ago will morph into a much larger correction.
What makes this particular pullback special, however, is the large surge in volatility (ChicagoOptions:^VIX) on the heels of relatively small declines (NYSEARCA:DIA).
(Audio) Listen to Ron DeLegge @ The Index Investing Show
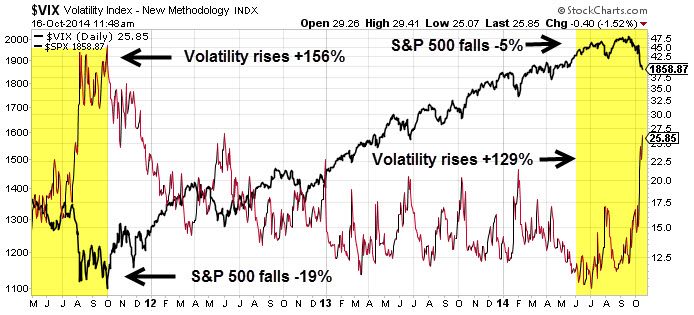
For perspective, the chart below shows how volatility (NYSEARCA:VXX) in 2011 jumped 156% on a decline of 19% for the S&P 500 (NYSEARCA:VOO). By comparison, the S&P 500’s decline 5% over the past three months has translated into an incredible 129% jump in the VIX. If volatility is capable of a 129% surge on modest single digit declines, what’s it capable of doing when the real selling kicks in?
VIX is an important sentiment gauge that investors should not overlook. At the very least, it offers us a compact view of the stock market’s psychology.
My video “Has Stock Market Volatility Gone Completely Away” was published when the VIX traded under 13 and when Wall Street’s talking heads proclaimed stock market volatility (NYSEARCA:UVXY) would remain low indefinitely. Boy were they wrong!
Thus far, our latest timestamped volatility trade from our 9/3/14 subscriber alert is still open and +260%. The right time to prepare for higher volatility is always the same; before it happens. All readers get email and text alerts.
The ETF Profit Strategy Newsletter uses technical analysis, market history along with common sense to keep investors on the right side of the market.
Follow us on Twitter @ ETFguide