“Men, it has been well said, think in herds; it will be seen that they go mad in herds, while they only recover their senses slowly, one by one,” said Charles MacKay in his classic book the Madness of Crowds.
A closer examination of the U.S. stock market’s (NasdaqGM:QQQ) action shows how the herd is at it again and how this may indeed be the weakest bull market by historical standards.
Although the Nasdaq Composite hit a 14-year high and the S&P 500 (NYSEARCA:VOO) hit an all-time high of 1,858 (along with erasing year-to-date losses), this particular bull run isn’t as strong as the headlines make it seem.
Speculative Stocks
One of the first signs of a frothy market is when the frenzy for speculative stocks and initial public offerings (IPOs) becomes insatiable. This was true during the dot com bust and it’s true right now.
In the biotech sector (NasdaqGIDS:IBB), less than a third of the 122 stocks within the Nasdaq Biotech Index are even making any money, yet the index has surged 86% over the past year.
WATCH: “Stocks Don’t Need to be Overvalued to Crash”
The market’s appetite for marijuana stocks along with profitless companies like Zynga, FireEye, and Groupon is high too. The latter have been among the leading performance gainers within the Russell 1000 (NYSEARCA:IWB), a large cap benchmark of U.S. stocks.
Waning Leadership
Although broad market yardsticks like the S&P 500 may be at record highs, just 95 stocks hit new 52-week highs, which is a far cry from the S&P 500’s May 2013 peak when almost 200 companies confirmed the top.
This same lack of confirmation pattern of fewer and fewer stocks participating in the rally is an eerily similar pattern to the pre-crash stock market of 2007.
Non-Confirming Volume
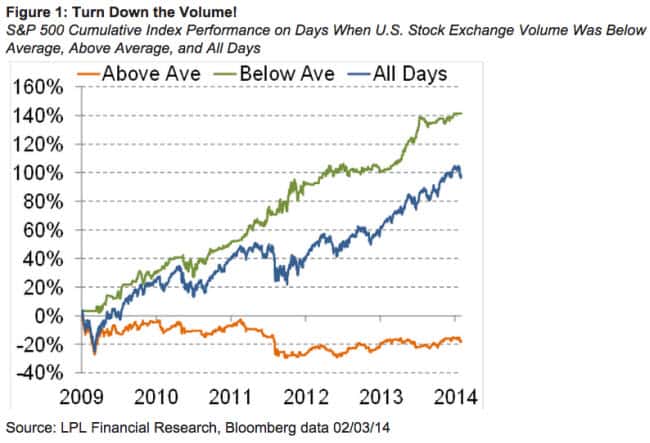
Trading volume will either validate or invalidate the significance of an index or security’s performance. And the importance of trading volume behind price moves cannot be conveniently minimized or ignored.
Previous bull markets in the 1980s, 1990s, and 2000s all occurred on brisk or rising trading volume, which is not the case with the post-2008 bull.
As the accompanying chart shows, the S&P’s (^GSPC) five-year advance has been on the heels of below average trading volume. What’s the translation? Not only does this particular bull market have less conviction compared to previous bulls, but you’ll notice how the above average trading volume during this particularly cycle is closely aligned with stock market selling. Only a blind bull would say none of this matters!
Finally, what about fear?
On multiple occasions, including today, the VIX (ChicagoOptions:^VIX) – a common measure of stock market fear – has not hit 52-week lows, even as the S&P 500 was making all-time highs.
All of this illustrates the nonconformity of this particular bull compared to its predecessors. Besides being a weaker bull, it may also turn out to be the most dangerous ever.
The ETF Profit Strategy Newsletter uses technical, fundamental, and sentiment analysis along with market history and common sense to keep investors on the right side of the market. In 2013, 70% of our weekly ETF picks were gainers.
Follow us on Twittter @ ETFguide