Today, there is a singular focus by certain investors on minimizing investment cost. In their world, cost is the only thing that matters. Unfortunately, this exceedingly narrow view fails to acknowledge that curtailing your portfolio’s cost is only part of the overall puzzle for obtaining satisfactory investment results. What do I mean?
Think about it this way: An investment portfolio with super ultra-low cost that’s ignorant about risk, diversification, taxes, and performance will not help you to get ahead. In other words, a misaligned portfolio at any cost – high or low – is no way to properly invest your money.
(Audio) Ron Analyzes and Grades a $26.9 Million Portfolio
My latest Portfolio Report Card is for JL, a married couple in their mid-40s living in Connecticut. They are self-employed, have two children, and manage their own investments.
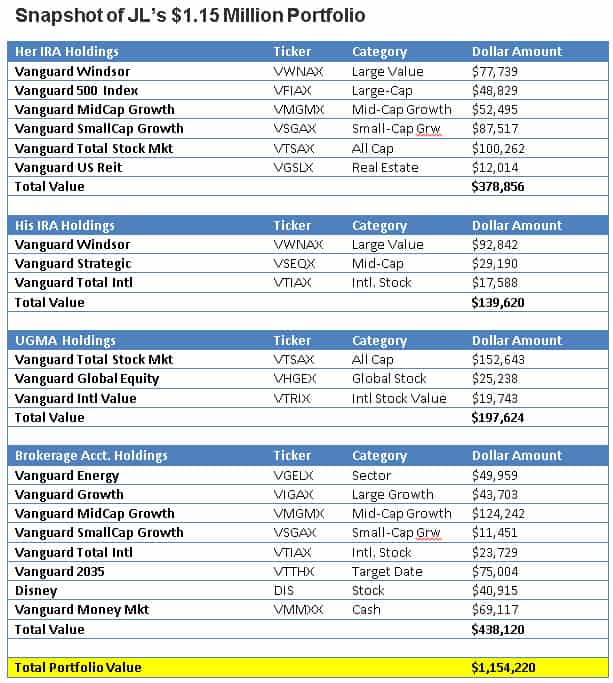
JL’s $1.15 million portfolio consists of a taxable brokerage account, two traditional IRAs, two SEP IRAs, two UGMA accounts, a rollover IRA and a Roth IRA. Altogether, they own 21 mutual funds and one individual stock (Disney).
JL asked me to do a Portfolio Report Card analysis on their combined portfolios to find out if they’re investments are properly aligned. As a reminder, the Portfolio Report Card is not an assessment about whether JL has saved an adequate amount of money for retirement, but rather, a diagnosis on the financial condition of their current investments in five key areas: cost, diversification, risk, taxes, and performance.
What kind of grade does JL’s portfolio get? Let’s evaluate it together.
Cost
Among the easiest ways to minimize the threat of investment cost is to minimize trading activity. For investors that use mutual funds or ETFs, sticking with funds that are linked to indexes is another way to cut the negative impact of cost.
J.L’s combined portfolios own 21 mutual funds from Vanguard with annual fund fees that range from 0.05% to 0.61%. Interestingly, the three largest holdings – the Vanguard Mid-Cap Growth (Nasdaq:VMGMX), Vanguard Total Stock Market (Nasdaq:VTSAX), and Vanguard Explorer (Nasdaq:VEXPX) – all have expense ratios under 0.30% which means that J.L. has made a deliberate choice to minimize investment cost. Is that something we should all be doing?
Diversification
A truly diversified investment portfolio always has exposure to the five major asset classes: stocks, bonds, commodities, real estate, and cash. How does JL’s portfolio do?
The combined portfolios have exposure to U.S. and international stocks, real estate, and cash. Well done!
However, the portfolio suffers from over-diversification by holding too much of the same thing. For instance, her SEP IRA owns VTSAX, which invests in same areas as (Nasdaq:VFIAX), (Nasdaq:VMGMX), and (Nasdaq:VSGAX). Furthermore, the portfolio misses exposure to two major asset classes: bonds (NYSEARCA:AGG) and commodities (NYSEARCA:GSG). Also, international real estate exposure is missing.
Risk
“I’m a long-term investor” or “the stock market always bounces back” are not credible forms of risk management. Why? Because diligent and proper risk management is always proactive versus being passive or reactive.
Furthermore, a portfolio’s risk character should always be 100% compatible with an investor’s risk profile and the portfolio’s asset mix should also be age-appropriate.
JL described themselves as aggressive investors with an investment time horizon that extends longer than 10-years. Their overall asset mix is the following: 93% stocks, 1% real estate and 6% cash. Their current asset mix is heavy on stocks and is probably more aggressive than they understand. Put another way, a 20% to 40% correction in equities exposes the total portfolio to potential losses of $214,000 to $428,000.
Tax Efficiency
Well-built investment portfolios are always aggressive at reducing the threat of taxes.
Thankfully, JL has not made any premature retirement plan distributions and the funds they own are doing a good job at limiting tax liabilities.
Performance
The performance of an investment portfolio will either validate or incriminate its construction. How does JL’s portfolio do?
From March 2014 to March 2015, this portfolio gained 10.2% ($99,263) compared to a 11.5% for a blended index benchmark matching this same asset mix. Although JL’s performance slightly underperformed our index benchmark for this period, the margin of underperformance wasn’t much.
The Final Grade
JL’s final Portfolio Report Card grade is “B.” (Good) Being nimble by cutting investment cost and taxes is this portfolio’s strongest grading categories.
On the other hand, the portfolio’s weakest grading category is risk and 93% exposure to equities exposes the portfolio to significant volatility and potentially large market losses.
Also, diversification was another problem area. Parts of the portfolio are over-diversified with too much exposure to the same areas, while other parts are under-diversified with no exposure to key asset classes like bonds and commodities.
In conclusion, JL are excellent savers and if they fix the weaknesses we identified inside their portfolio, I’m confident they will reach their financial goals.
Ron DeLegge is the Founder and Chief Portfolio Strategist at ETFguide. He’s inventor of the Portfolio Report Card which helps people to identify the strengths and weaknesses of their investment account, IRA, and 401(k) plan.


