For just the fourth time in 50 years, the S&P 500’s (NYSEARCA:IVV) dividend yield was briefly more versus 10-year U.S. Treasuries (ChicagoOptions:^TNX). It’s another testament to the difficult climate facing bond investors (NYSEARCA:BOND) who want to generate a respectable level of income.
For good reason, more people are employing alternative income strategies like selling covered calls.
The covered call technique (also known as a “buy-write strategy) happens when an investor buys a stock or ETF and sells (or writes) call options on the underlying or covered position. The strategy can be used to enhance portfolio returns via income and even reduce market volatility.
(Audio) Portfolio Report Card: Analyzing and Grading a $818,000 Investment Account
The CBOE S&P 500 BuyWrite Index (NYSEARCA:BWV) is a benchmark linked to the performance of a hypothetical buywrite strategy on the S&P 500. The BuyWrite index was released in 2002 and is based on (1) buying an S&P 500 index portfolio, and (2) writing the near-term, at-the-money S&P 500 “covered” call option, generally on the third Friday of each month. The premium collected from the sale of the call is added to the portfolio’s total value. The call is held until expiration, typically the third Friday of the following month, at which time a new one-month, at-the-money call is written. If exercised, the expired option is settled in cash.
No income strategy, whether it’s investing in dividend paying stocks (NYSEARCA:DVY) or selling covered calls is perfect.
Nevertheless, selling covered calls is a proven long-term income strategy. Since inception in Feb. 2012, our Income Mix ETF Portfolio has generated $29,354 or $838 per month. The portfolio uses a disciplined but simple covered call approach on an all ETF portfolio.
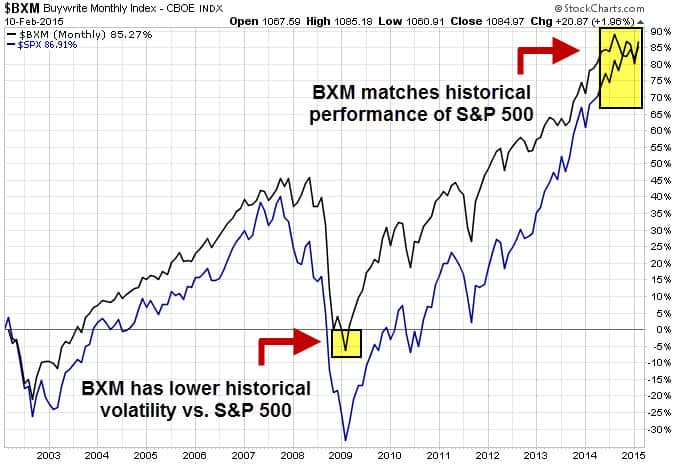
Additionally, the risk-adjusted performance of the BuyWrite index versus the S&P 500 has been superior.
Since it debuted in 2002, the BuyWrite index has generated a performance return comparable to the S&P, but with substantially less volatility. (See chart above)
An 18-year study (1988-2006) by Callan Associates showed the BuyWrite Index delivered a compounded annual return of 11.77% compared to 11.67 percent for the S&P 500. The BXM returns were generated with a standard deviation of 9.29%, two-thirds of the 13.89% volatility of the S&P 500.
Follow us on Twitter @ ETFguide