This just in: U.S. stocks are at record highs, but caveat emptor. Why? Because fewer and fewer stocks are participating in the rally.
Almost half of the stocks (47%) within the Nasdaq Composite (NYSEARCA:ONEQ) are 20% lower from their peak over the past year. And although Apple (NasdaqGS:AAPL), Facebook (NasdaqGS:FB), and Microsoft (NasdaqGS:MSFT) have lifted the Nasdaq to a year-to-date 8.6% return, the average stock within the index is down around 24% and in a bear market.
WATCH: Portfolio Report Card: Here’s What a $512,000 One-Trick Pony Looks Like
The Russell 2000 small cap index which tracks companies with an average market size of just $1.8 billion is in a similar situation. Around 40% of its components are down by at least 20% or more.
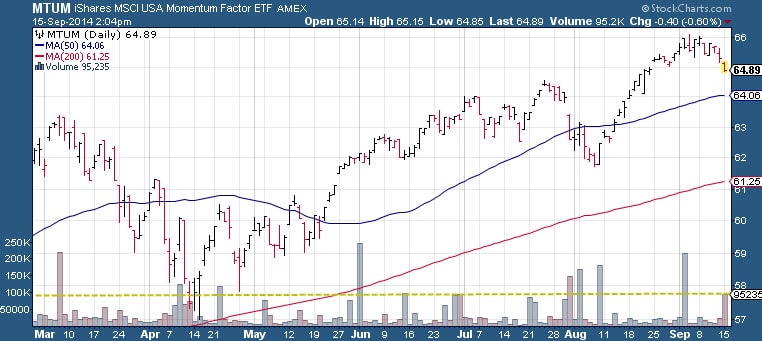
The iShares MSCI USA Momentum Factor ETF (NYSEARCA:MTUM), one proxy of equity momentum investing, still trades above both its 50-day and 200-day moving average. In August, MTUM dipped briefly below its 50-day moving average but it remained above the 200-day average, signaling an intact uptrend.
Nevertheless, healthy bull markets should always have broad participation by not just the largest stocks, but mid and small caps too.
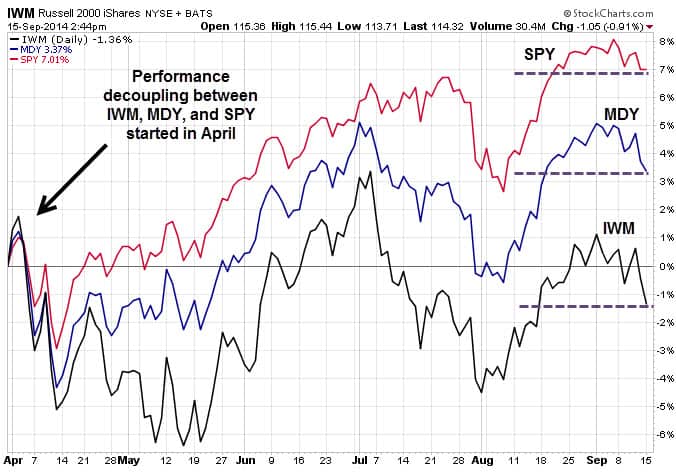
The decoupling in performance between these equity segments (large, mid, and small caps) began in April and has become more pronounced. Since April 1, the S&P 500 (NYSEARCA:IVV) has risen 7.01% while the S&P 400 MidCap Index (NYSEARCA:MDY) has risen just 3.37% and the iShares Russell 2000 Small Cap ETF (NYSEARCA:IWM) has slid 1.36%.
“The last thing to collapse is the surface,” said Albert Einstein. That’s why it’s important to understand what’s happening underneath the superficiality of market highs.
The ETF Profit Strategy Newsletter uses technicals, fundamentals, discipline and common sense to find opportunities that others miss.
Follow us on Twitter @ ETFguide


