Your investment portfolio is nothing more than a reflection of who you are. In other words, it’s a personal statement about how you approach financial risk, investment cost, diversification, and taxes. If you’re disorderly when it comes to these aspects of your investment plan, the unwelcome consequences will be a disorderly portfolio with disorderly results.
My latest Portfolio Report Card is for LL, a married couple in Dallas, TX. He’s 48 and works in the telecommunications field and she is a 42-year old housewife.
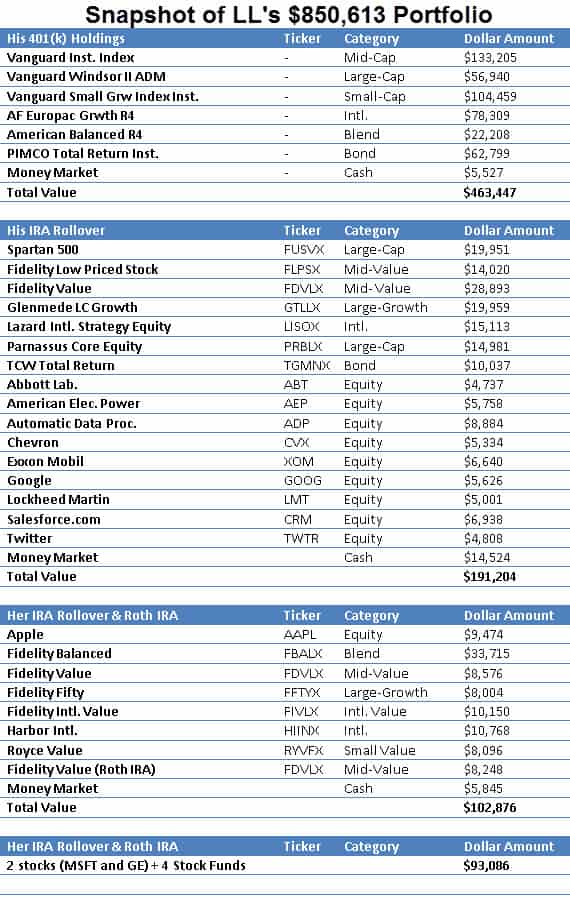
LL’s $850,613 investment portfolio consists of two rollover IRAs, one Roth IRA, one 401(k) plan, and a joint brokerage account. LL told me their investment goal is to have enough money to retire by age 60 and $2 million is their ideal target. LL self-manages their portfolio and the combined portfolios own 22 mutual funds, 12 individual stocks, and cash.
(Audio) Ron Dissects and Grades a $26.9 Million Portfolio
LL is an aggressive growth investor and asked me to analyze and grade their combined portfolios.
What kind of grade does LL’s portfolio get? Let’s analyze it together.
Cost
Deliberately minimizing trading costs, fund fees, and other frictional expenses are the hallmarks of all well-built portfolios.
The mutual fund holdings in LL’s combined portfolios (minus the 401k plan) have an average expense ratio of 0.67%. This is 3.5 times higher compared to our index ETF benchmark.
Here’s another way to think about LL’s portfolio costs: If LL averages 8% over the next 15 years they’ll have around $2,187,000 with their current fee structure compared to $2,341,000 million with lower fee funds. That’s a whopping $154,000 difference! LL needs to do a better job at minimizing investment cost.
Diversification
Portfolio diversification is all about spreading your financial risk across a variety of asset classes instead of plowing your money into one thing.
This portfolio has exposure to U.S. and international stocks, bonds, and cash. This is outstanding! However, this portfolio suffers from over-diversification by holding too much of the same thing. Although this portfolio owns different fund ticker symbols, many of the funds have duplicated exposure to large and mid-cap stocks.
Over-diversification happens again in his 401(k) plan and her IRA rollover with exposure to balanced funds, creating needless overlapping exposure to both stocks and bonds already held by other funds in their portfolio.
Finally, the combined portfolios miss exposure to two major asset classes: commodities (NYSEARCA:DBC) and real estate (NYSEARCA:REET).
Risk
A portfolio’s risk character should always be 100% compatible with the risk profile of the investor and it should also be age-appropriate.
The overall asset mix of this total portfolio is the following: 89% stocks (NYSEARCA:VTI), 8% bonds (NYSEARCA:BOND), and 3% cash. This is a hyper-aggressive asset mix that subjects LL to high volatility and substantial market risk. A 20% to 40% stock market correction exposes this portfolio to potential market losses of $170,000 to $340,000.
Tax Efficiency
Smartly constructed investment portfolios should always minimize the threat of taxes. And thankfully, the tax-efficiency for LL’s portfolio is OK. They have not taken any 401(k) loans or premature retirement plan distributions.
However, on the taxable brokerage side, almost $60,000 is invested in actively managed mutual funds (Nasdaq:RYVFX) and their tax-efficiency could be improved by simply owning more tax-efficient funds like index mutual funds or ETFs.
Performance
How an investment portfolio performs will either validate or incriminate its design. How did LL do?
The combined portfolios gained 9.8% from February 2014 to February 2015 compared to a +12.61% blended index benchmark matching their same asset mix. LL underperformed our index benchmark and their performance was unsatisfactory. Remember: Performance should match or exceed index benchmarks.
The Final Grade
LL’s final Portfolio Report Card grade is “C.” (Weak) This portfolio’s weakest grading categories are diversification, risk, and performance. The strongest grading category is tax-efficiency.
The overall asset mix 89% stocks (Nasdaq:FDVLX) , 8% bonds, and 3% cash asset mix is hyper aggressive and is not age appropriate.
Diversification is uneven, with parts of the portfolio being over-diversified and other parts being under-diversified. Also, LL misses two major asset classes and yet still makes room to invest in individual stocks. Buying individual securities shouldn’t happen until your portfolio is first fully and properly diversified.
In summary, LL are good savers and with a few tweaks, they can become even better investors.
Ron DeLegge is the Founder and Chief Portfolio Strategist at ETFguide. He’s inventor of the Portfolio Report Card which helps people to identify the strengths and weaknesses of their investment account, IRA, and 401(k) plan.
Follow us on Twitter @ ETFguide