It seems nobody on Wall Street can stop talking about how the S&P 500 just breached its 200-day moving average for the first time since November 2012. From bedazzled TV anchors to nouveau bears, it’s suddenly everybody’s favorite chart, minus Abby Joseph Cohen.
The other chart nobody wants to discuss is the significant outperformance of long-term U.S. Treasuries (ChicagoOptions:^TYX) over U.S. stocks (NYSEARCA:IVV). In case you’ve been hibernating, bond yields on 10-year U.S. Treasuries (ChicagoOptions:^TNX) have fallen to 2.20% near 52-week lows.
WATCH: Pass or Fail? Ron grades a $353,000 retirement account
For context, it’s important for you to understand that 100% of the Wall Street analysts predicted lower bond prices and higher yields at the start of 2014. Furthermore, this incorrect macro view (fancy language for bad advice) has been perpetrated throughout the year.
Here’s what they’ve been saying:
“Doug Casey: Bond Bubble Blowing Up” – USAWatchDog.com, Jan. 29, 2014
“Beware the Bond Bubble” – Mauldin Economics, May 27, 2014
“Beware the Enormous Bubble in Bonds” – MarketWatch, Aug. 29, 2014
“David Tepper: ‘Beginning of the End’ of Bond Bubble” – ZeroHedge, Sep. 4, 2014
Like their predecessors, 100% of the Wall Street prognosticators listed above are dead wrong about today’s bond market (NYSEARCA:AGG).
The 24% drop in long-term Treasury yields has translated into another monster rally in bond prices that Wall Street’s loyal minions have missed.
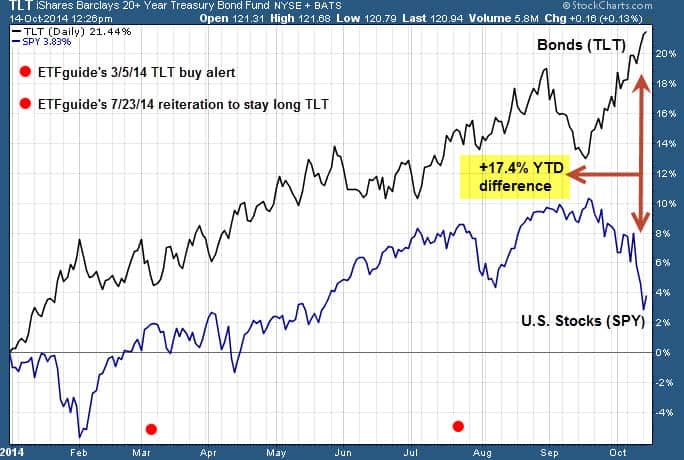
The chart below plots the year-to-date performance of the SPDR S&P 500 ETF (SNP:^GSPC) against the iShares Barclays 20+ Yr U.S. Treasury ETF (NYSEARCA:TLT). As you can see, not once has SPY come close to beating TLT this year and the outperformance by long-term U.S. Treasuries over U.S. stocks (NYSEARCA:DIA) continues to widen. You’ll also notice our timestamped trade alerts given to readers located on the left side of the chart. If this is your definition of a bond market crash, go back to sleep!
Among top performing ETFs in 2014 are the same funds that Wall Street said would crash and burn; the 2x daily leveraged ProShares Ultra 20+ Yr. U.S. Treasury ETF (NYSEARCA:UBT) and the 3x daily Direxion Daily 20+ Yr. Treasury Bull 3x Shares (NYSEARCA:TMF). UBT is +28.93% while TMF is ahead by +44.52% YTD.
My article titled “So This is Bursting of the Bond Market’s Bubble” charted the performance of long-term U.S. Treasuries versus the S&P 500 during the 2008-09 financial crisis. I did this to provide historical backdrop for all haters of market history. Remember: We don’t predict market trends, we just help people to profit from them.
The ETF Profit Strategy Newsletter uses technical analysis, market history along with common sense to keep investors on the right side of the market. Thus far, our largest year-to-date winner is a +188% timestamped gain for our Weekly Picks on June 5. All readers get email and text alerts too.
Follow us on Twitter @ ETFguide


