Is the risk character of your investments compatible with you? If not, it’s a telltale sign that your investment portfolio is seriously flawed.
Frequently, these risk incompatibilities are camouflaged by an uptrending stock market. But when the market reverses and volatility (NYSEARCA:VXX) jumps, the problems of investment portfolios with unsuitable risk levels becomes apparent.
My latest Portfolio Report Card is for PK a 74-year old single retiree living in Colorado. He asked me to analyze and grade his $ 1,756,192 investment account which consists of a taxable trust account and Roth IRA.
GET: Your complimentary 4-Step Bear Market Plan by texting 33444 and typing the word “CRASHPLAN”
PK told me in Oct. 2013 he gave his portfolio to an investment advisor who sold everything and set up the current portfolio. Prior to that he had invested heavily in commodities, gold, and technology, and had not done well.
His Roth IRA has $684,376 while his taxable trust account has a value of $1,071,816 and both accounts are advisor managed.
How does PK’s portfolio do when it comes to cost, risk, diversification, taxes, and performance? Let’s find out.
Cost
Reducing investment cost, commissions, and transactions should be a priority for all investors. Why? Because the less you spend, the more you keep. How does PK do?
Some of PK’s holdings like the American Funds Washington Mutual (Nasdaq:WSHFX), American Century Mid-Cap Value (Nasdaq:ACMVX), and American Euro Pacific Growth (Nasdaq:AEGFX) have obscured 12b-1 fees that get funneled to his advisor. Yet, this same advisor is collecting another 0.85% on top of the 12b-1 fees. Talk about double dipping!
Overall, PK’s portfolio holds 33 mutual funds in the taxable trust account and 26 mutual funds in the Roth IRA. The asset weighted annual fund expenses are 0.71% plus another 0.85% for advisor fees which pushes the portfolio’s annual expenses to 1.66%.
The cost of PK’s portfolio is eight-times higher versus a blended benchmark of index ETFs matching PK’s asset mix.
Diversification
Any investment portfolio without broad market exposure to the five major asset classes – stocks, bonds, commodities (NYSEARCA:GSG), real estate, and cash – is not adequately diversified.
PK’s portfolio has exposure to US and international stocks (NYSEARCA:EFA), bonds (Nasdaq:SWNTX), commodities (Nasdaq:PCDLX), real estate (CSRSX), and cash. Outstanding! However, the portfolio has several overlapping positions which creates a condition known as over-diversification.
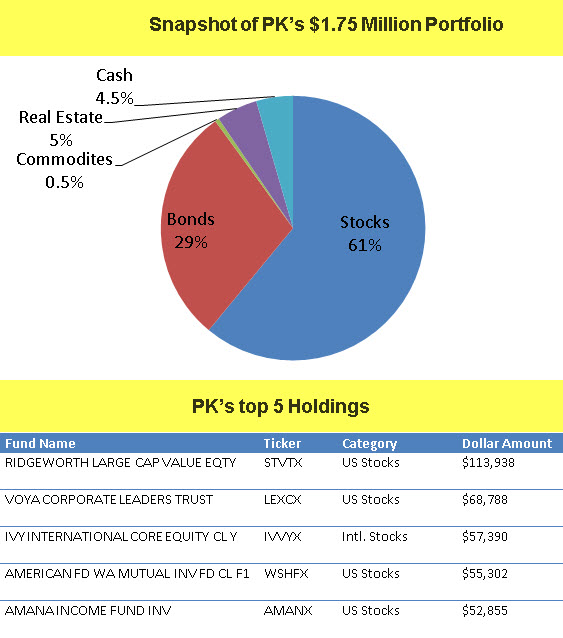
For example, PK owns duplicated exposure to U.S. large cap stocks via the Ridgeworth Large Cap Value Fund (STVTX), American Funds Washington Mutual (WSHFX), American Funds New World (NWFFX), and Voya Corporate Leaders (LEXCX).
A contributing problem to PK’s portfolio diversification shortcomings is that he owns way too many mutual funds; 33 in the trust account and 26 in his ROTH IRA.
In the end, PK’s portfolio has sloppy diversification, which is all the more unacceptable because it was assembled by a fee-charging advisor.
Risk
PK told me, “I like having a safe, balanced investing strategy that does not take a lot of management.” On my 10-point risk scale, he was five, which makes him a moderate investor. He also told me his investment time horizon is five to 10 years.
The overall asset mix of PK’s total portfolio is the following: 61% stocks, 29% bonds, 5% real estate, 0.5% commodities, and 4.5% cash. This asset mix tilts on the aggressive side for a mid-70s moderate investor. A 20% to 40% market decline would subject the combined portfolios to potential market losses of $212,000 to $425,000.
(Audio) Portfolio Exam: Grading a $1.1 Million Account + Are ETFs to Blame for Stock Market Dislocations?
Tax Efficiency
PK’s overall tax-efficiency is OK for the Roth IRA, but can be improved in the trust account. Most of the active funds held in this account aren’t particularly tax-efficient because they have elevated tax cost ratios. PK could definitely benefit by owning more tax-smart investment vehicles like index ETFs. Why hasn’t his financial advisor done this?
Performance
PK’s portfolio grew $32,886 (+1.9%) from June 2014 to June 2015 vs. a gain of +1.9% for the index benchmark matching his same asset mix.
Although he matched the performance of a blended index ETF benchmark over the past year, PK’s portfolio costs are eight times higher. In other words, he would’ve done better had he simply invested in a basket of index ETFs matching up with his asset mix!
The Final Grade
PK’s final Portfolio Report Card grade is “C” (weak). This means his portfolio has major flaws in three out of five grading categories.
Cleary, the cost of PK’s portfolio is excessive, his diversification is sloppy, his portfolio’s risk is elevated, and his advisor is directly responsible for the mess. Additionally, PK’s portfolio has 59 mutual fund positions, which is overkill for a portfolio of this size.
Although PK’s one-year performance matched the benchmark, he could’ve enjoyed identical results with eight times lower cost by simply investing in index based ETFs.
Now that PK’s portfolio has been diagnosed, it’s up to him to fix the flaws. And I can confidently say that firing his current advisor would be an excellent place to start.
Ron DeLegge is the Founder and Chief Portfolio Strategist at ETFguide. He’s inventor of the Portfolio Report Card which helps people to identify the strengths and weaknesses of their investment account, IRA, and 401(k) plan. Does your portfolio pass or fail?


